From Complexity to Operational Clarity: How ABB Smart Power Unlocked Forklift Traffic Insights
Alphasense Tracker is an infrastructure-free RTLS solution for monitoring traffic flows of manual industrial trucks. Operational teams use a data dashboard to analyze KPIs, visualize traffic patterns, and integrate third-party software for live visualization and mixed-fleet coordination with AGVs and AMRs.
Request A Meeting
Please fill out your details below. Our team will reach out to you by email to schedule a date and time.
Like many factories, ABB in Alingsås, Sweden, had strong instincts about where to improve forklift logistic flows and hence also increase safety, but needed data to be sure. The site team wanted a low-friction way to validate those assumptions, quantify the impact, and build a business case for continuous improvement in material flow.
By equipping three forklifts with Sevensense’s Alphasense Tracker for a six-day proof-of-value, the team mapped 8,000 m² of production and storage areas, logged 193 km of driving, and collected granular safety and utilization KPIs.
The result: a clear, visual baseline of how forklifts really move, where risks concentrate, and which operational tasks and shifts offer the most immediate opportunities for optimization.
“The Alphasense Tracker installed by Sevensense has supported two ongoing improvement projects, one of which focused on making our kitting process more efficient, and the other focused on reducing waste in our material handling in and around one of our production processes. The data provided has enabled us to quantify suspected improvement areas and has helped us visualize the work environment that surrounds our forklifts and processes.” Carl Troiza, Continuous Improvement Specialist at ABB Smart Power in Alingsås, Sweden
From gut feeling to data-driven intralogistics
In October 2025, ABB Smart Power in Alingsås partnered with Sevensense to run a focused proof-of-value using Alphasense Tracker, a visual-SLAM-based real-time locating system (RTLS) for manual material handling trucks.
Three forklifts were equipped, the facility was mapped, and detailed traffic, utilization, and safety indicators were recorded across day and night shifts—without any external infrastructure.
One-day deployment, full-facility visibility
Speed and minimal disruption were critical success factors for the project.
- Each device was installed and configured in less than 30 minutes, drawing power from existing lines without affecting the vehicle's uptime.
- The forklifts themselves were used to map around 8,000 m² of production halls, storage tents, and outdoor areas, generating a metrically accurate digital map shared across all three vehicles without the need for any additional infrastructure (i.e. reflectors).
- Map updates ran automatically, so the system kept pace with layout or inventory changes.
Data consolidation
The collected data is consolidated into separate datasets by accumulating the recordings according to two specific approaches:
- Analysis by operational task: The recorded data of each forklift operating in a specific time shift of the day is consolidated across multiple days.
- Analysis by day: The recorded data for all forklifts is consolidated each day over the entire recording period.
KPIs Tracked
- Distance driven: The total length of all paths driven during the recorded period, expressed in kilometers.
- Time in operation: The duration of the recording period during which forklifts are in motion. When considering data from multiple forklifts operating in parallel, this metric is the sum of the time in operation of the individual vehicles.
- Time at standstill: The duration of the recording period during which forklifts are not moving.
- Utilization rate: The ratio between the time in operation and the total recording time, expressed as a percentage.
- Average speed during operation: The average speed of all recorded vehicles while in motion, i.e., excluding time spent at a standstill. When considering data from multiple forklifts operating in parallel, this metric is the mean of the average speed during operation of the individual vehicles.
- Driving time above 10 km/h: The total time across all recorded vehicles in the dataset during which their speed exceeded 10 km/h.
- Number of shocks detected: The count of events where the Alphasense Tracker registers absolute accelerations greater than 1.5G on the horizontal plane.
Data Visualization
- Spaghetti diagram: This visualization overlays the paths driven by recorded forklifts onto a plant blueprint. If multiple forklifts are recorded, their paths are displayed in different colors.
- Position heatmap: The heatmap overlays colored areas onto the plant blueprint. The colors indicate the areas traversed by the recorded forklifts, with the color intensity reflecting the frequency of traversal during the recording period.
- Velocity heatmap: Similar to the position heatmap, the visualization overlays colored areas onto the plant blueprint. The colors indicate the areas traversed by the recorded forklifts, and the color intensity represents the average speed at which these surfaces were traversed during the recording period.
- Shock map: The map uses arrows on the plant blueprint to indicate the position and orientation of forklifts at locations where a shock (acceleration or deceleration exceeding 1.5G) was recorded.
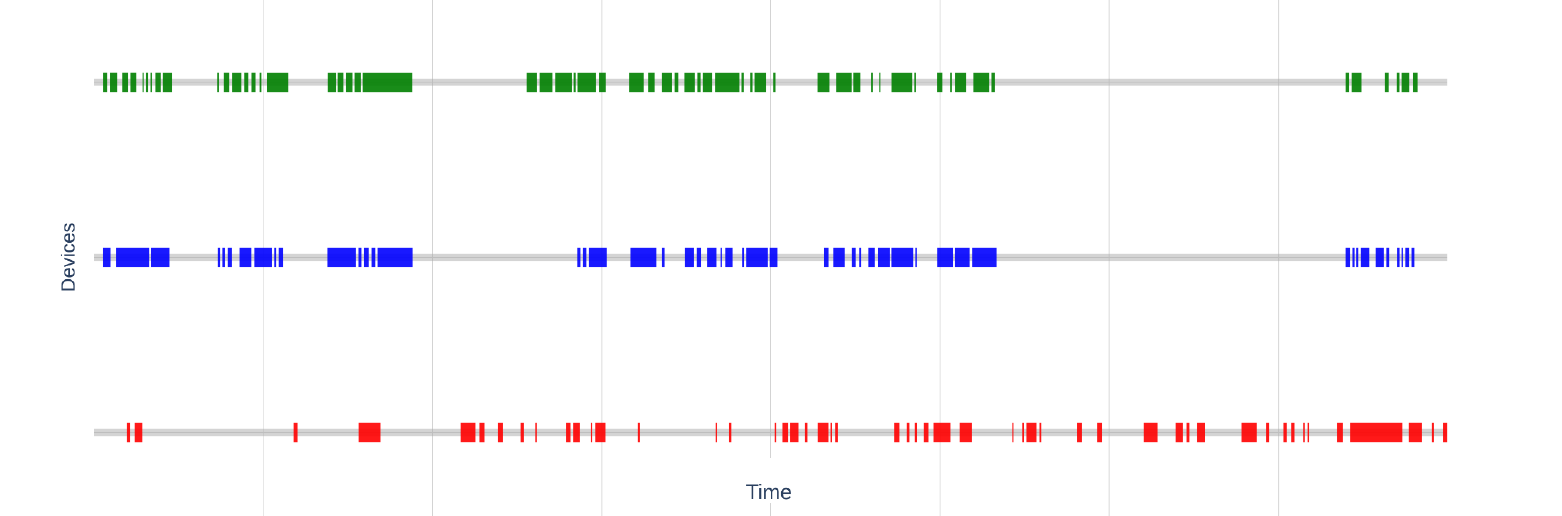
- Usage timeline: The time series displays the velocity of a recorded forklift over time. When analyzing multiple forklifts, their velocity plots are shown in different colors. Usage timelines are generated exclusively for day-by-day analyses.
Insights
A True Utilization Baseline
Before Alphasense Tracker, the unit had no precise measure of how much time forklifts actually spent driving versus standing still. With the collected data, utilization rates were calculated for each operational task.
Understanding utilization raises questions:
- Is the waiting productive (e.g., required staging)?
- Or is it caused by congestion, layout issues, or scheduling mismatches?
- Are resources being sized correctly?
With this new baseline, the unit now has a quantitative foundation for improvement — and a way to measure long-term progress.
Congestion Nodes Emerge Clearly on Heatmaps
The position heatmap highlighted:
- Repeated stopping nodes where forklifts queued or waited.
- Frequently used corridors forming the site’s “highways”.
- Crossings with consistent pauses suggesting traffic conflicts.
- Areas rarely visited that may represent underutilized space.
Seeing them mapped spatially allows the team to rethink layout decisions, pick-up zones, and internal traffic rules with confidence.
Shock Detection Exposes Hidden Risks in Flooring and Layout
Shocks — accelerations over 1.5G — are early indicators of:
- Floor defects.
- Collisions.
- Aggressive driving behavior.
This supports considering optimization measures:
- Floor repairs.
- Route widening.
- Storage decluttering.
- Improved visibility around corners.
- Driver training focused on approach behavior.
A validated baseline
Beyond immediate insights, the proof-of-value validated a scalable approach to data-driven intralogistics.
To move from first findings to sustained impact, ABB Smart Power in Alingsås identified continuous fleet-wide tracking as the next step. With long-term data, the site can:
- Track how KPIs evolve as new layouts, schedules, or traffic rules are introduced.
- Detect deviations from established baselines, such as sudden increases in shocks in a particular zone or drops in uptime for specific vehicles.
- Run “before/after” experiments on process changes and quantify their effects on safety and efficiency.
In this way, forklift tracking becomes a backbone for a continuous improvement loop, connecting daily decisions on the shop floor with measurable outcomes.
How Alphasense Tracker Powers The Journey
Alphasense Tracker by Sevensense provides a complete, infrastructure-free solution for monitoring traffic flows of manual industrial trucks, including forklifts, tugger trains, and other moving equipment. Operational teams can use a data dashboard to select time ranges, extract KPIs, and visualize traffic patterns, while also integrating third-party software for live traffic visualization or coordination of mixed fleets with AGVs and AMRs.
A Technology That Works With Your Existing Fleet
A key reason this proof-of-value succeeded is that the Alphasense Tracker is designed specifically for manual industrial vehicles. It does not disrupt operations or require new infrastructure.
Get in Touch and Learn More About Alphasense Tracker.


'%3e%3cg id='Final-Copy-2_2_' transform='translate(1275.000000, 200.000000)'%3e%3cpath class='st0' d='M7.4,12.8h6.8l3.1-11.6H7.4C4.2,1.2,1.6,3.8,1.6,7S4.2,12.8,7.4,12.8z'/%3e%3c/g%3e%3c/g%3e%3c/g%3e%3cg id='final---dec.11-2020'%3e%3cg id='_x30_208-our-toggle' transform='translate(-1275.000000, -200.000000)'%3e%3cg id='Final-Copy-2' transform='translate(1275.000000, 200.000000)'%3e%3cpath class='st1' d='M22.6,0H7.4c-3.9,0-7,3.1-7,7s3.1,7,7,7h15.2c3.9,0,7-3.1,7-7S26.4,0,22.6,0z M1.6,7c0-3.2,2.6-5.8,5.8-5.8 h9.9l-3.1,11.6H7.4C4.2,12.8,1.6,10.2,1.6,7z'/%3e%3cpath id='x' class='st2' d='M24.6,4c0.2,0.2,0.2,0.6,0,0.8l0,0L22.5,7l2.2,2.2c0.2,0.2,0.2,0.6,0,0.8c-0.2,0.2-0.6,0.2-0.8,0 l0,0l-2.2-2.2L19.5,10c-0.2,0.2-0.6,0.2-0.8,0c-0.2-0.2-0.2-0.6,0-0.8l0,0L20.8,7l-2.2-2.2c-0.2-0.2-0.2-0.6,0-0.8 c0.2-0.2,0.6-0.2,0.8,0l0,0l2.2,2.2L23.8,4C24,3.8,24.4,3.8,24.6,4z'/%3e%3cpath id='y' class='st3' d='M12.7,4.1c0.2,0.2,0.3,0.6,0.1,0.8l0,0L8.6,9.8C8.5,9.9,8.4,10,8.3,10c-0.2,0.1-0.5,0.1-0.7-0.1l0,0 L5.4,7.7c-0.2-0.2-0.2-0.6,0-0.8c0.2-0.2,0.6-0.2,0.8,0l0,0L8,8.6l3.8-4.5C12,3.9,12.4,3.9,12.7,4.1z'/%3e%3c/g%3e%3c/g%3e%3c/g%3e%3c/g%3e%3c/svg%3e) Your Privacy Choices
Your Privacy Choices

